Model Evaluation
I am reviewing some basic topics in data science to regresh my memory. Here are my notes.
There are several evaluation metrics for binary classification (positive vs. negative). We can analyze the predictions by comparing with the actual values.
| . | . | true |
|---|---|---|
| predicted | tp | fp |
| . | fn | tn |
- False positives (fp) are also called type 1 error.
- False negatives (fn) are also called type 2 error.
precision_score
Precision is the ratio $P = \frac{tp}{tp+fp}$. It is the fraction of predicted positives that were actually right. It ranges from 0 to 1 where higher is better.
recall_score
Recall is the ratio $R = \frac{tp}{tp+fn}$. It is the fraction of actual positives that were actually right. It ranges from 0 to 1 where higher is better. Recall is also called the true positive rate (TPR), for obvious reasons.
f1_score
Precision and recall often conflict; improving one often lowers the other. We must trade off precision and recall to attain the optimal balance. To get this balance, we apply the f1 score, which is the harmonic mean of precision and recall:
Remember that the harmonic mean is the reciprocal of the arithmetic mean of the reciprocals. We can generalize the $F_1$ score to a weighted harmonic mean of precision and recall:
roc_auc_score
The classifier often gives a probability value, and we must then choose a threshold value (e.g. 0.5) to separate into negative or positive. The classifier’s performance varies with the probability threshold, and we want to measure performance over all possible thresholds (0 to 1).
The ROC curve plots the recall true positive rate (TPR) vs. the false positive rate (FPR) at various threshold values.
- TPR = recall = $\frac{tp}{tp+fn}$
- FPR = $\frac{fp}{fp+tn}$. It is the fraction of actual postives that were correctly predicted. An example ROC curve is shown below:
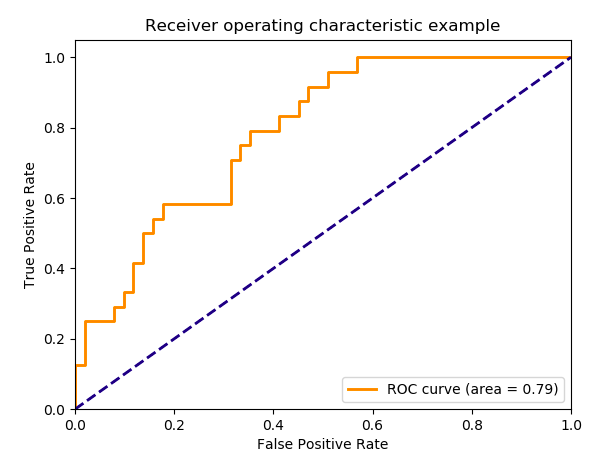
Ideally, the curve would hug the top-left corner: the TPR always 1 for all values of the false positive rate. We measure the area under the ROC curve and call it the AUC (area under the curve). AUC ranges from 0.5 to 1 with higher being better.
The AUC never drops below 0.5 because if it doesn’t you can invert every prediction and the AUC will flip about 0.5. Thus the identity line $x=y$ froms a “lower bound” on the ROC curve.
mean_squared_error vs. mean_absolute_error
Mean squared error and mean absolute error are performance metrics used for regression.
Definitions:
Mean squared error is penalizes large errors highly. This sensitivity can cause the model to focus on far observations over close observations. This tradeoff could be harmful if far-away observations are few (i.e. outliers); they would have a large impact because they are far despite their small count.
For example, outliers will have a large impact on a linear regression model. Outliers pull the regression away from more numerous close-by observations. One way to avoid this sensitivity to outliers is to use the mean absolute error (MAE), which penalizes outliers less. Using MAE will make the regression line less sensitivie to outliers.
MSE penalizes large errors more than MAE. Therefore, MSE should be used over MAE when large errors are particularly undesirable.
MSE and MAE can be found in sklearn in sklearn.metrics.mean_sqaured_error and sklean.metrics.mean_absolute_error.